According to the most recent data from the Bank of Canada, the average debt held by Canadians, excluding mortgages, is $20,759.
While that paints a broad picture of household debt in Canada, we analyzed data from the 3,000 Canadian households we helped this year. These families and individuals represent nationwide coverage from our 50+ debt restructuring offices across Canada.
What Too Much Debt Looks Like for a Canadian Family in 2026

The Bank of Canada and finance ministry have expressed concern over the debt average Canadians have been taking on, warning that some consumers could find themselves in financial straits when mortgage rates eventually rise.
One of the key trends we see when working with families across Canada is that the space between debt and a financial crisis is very short. Often, it just takes a few extra expenses to tip the scales. For example, a family might be keeping a short distance ahead of their debt and then an unexpected car repair is needed. This robs their cashflow and debt spirals from missing credit card payments to skipping a mortgage payment.
Frequently Asked Questions About What’s Too Much Debt in Canada (2026 Update)
How Much Household Debt Does Canada Have in 2026?
According to TransUnion’s quarterly household debt report, Canadian’s held $2.6 trillion in household debt at the end of 2025 and going into 2026, most of which is likely mortgage debt. Mortgage debt tends to be considerably more stable and lower risk than other types of debt, like credit card debt, or private loan debt.
The report also noted that Canadians were using credit more often in 2025 than in previous years.
How Much Debt Does the Average Canadian Have in 2026?
Not including mortgages, Equifax reported that the average debt for a Canadian is around $22,000 per person in 2026. This signals that Canadians may have adopted poor borrowing habits, and are finding themselves unable to pay off what they owe.
Along with this is Canada’s national debt-to-income ratio. A debt-to-income ratio helps you dictate whether the amount of debt you have is manageable based on how it compares to your income. In 2026, Canada’s average debt-to-income ratio is 178%. That means monthly debt obligations are around 1.78x higher than monthly income.
How Much Debt is Too Much in Canada (2026)?
There’s no single dollar figure that universally defines “too much debt” — it depends on your income, expenses, and financial goals. However, financial experts use benchmarks to help assess risk:
- A common rule of thumb: if your monthly debt payments exceed ~40% of your gross monthly income, you likely have too much debt.
- Lenders often look for a debt-to-income ratio (DTI) below 36–40% when approving loans.
How Do I Know If My Debt is Too Much?
You probably are dealing with too much debt if…
- You Have a High Debt-to-Income Ratio: If your monthly debt payments are over ~40% of your gross income.
- You’re Only Making Minimum Payments: Paying only the minimum on credit cards or loans for months without reducing the principal amount.
- You’re Borrowing Money to Cover Essentials: Using credit cards or loans for essential expenses like groceries or bills (without a plan to pay them off).
- Stress and Financial Strain: If debt is causing stress, anxiety, or affecting your quality of life or ability to meet goals, that’s a strong sign it’s too much for you to handle alone.
About this data
This is internal data gathered from the families, individuals, and companies that came to us for debt restructuring services in 2014. A few key trends to note:
Average Family Income
The income has not changed significantly in the last three years. This is keeping track with the marginal or stagnant increase in wages for Canadians. The slow growth of wages, combined with the continued increase in the costs of property ownership have increased the amount of financial pressure felt by Canadians.
The increase in spousal income really demonstrates the need for the spouse to work more in an effort to meet the rising cost of raising a family in Canada.
Bankrupt Before
Although the increase is only from 12.52% to 13.61% it represents an 8.7% increase in the number of 2nd time Bankruptcies in only 3 years. This is even more alarming when considering that the overall number of insolvencies have dropped from 122,999 to 118,678 or about 3.6%. This means that although the number of people falling into financial trouble have decreased the actual number of repeat offenders has increased.
This supports the findings that consumers are NOT learning the required skills to make the right financial decisions based on solid financial literacy skills after bankruptcies and consumer proposals. Far too many people that are left in a void with no clear path to financial recovery after a debt restructuring plan.
Consumer Debt Levels
With stagnant wages it’s not surprising to see the average client entry increase. This is just a measure of what is the average entry from all the entries made and it shows an increase from 7131 to 8776.92 or 23% in just 3 years.
The average unsecured single filing of a client debt load has fallen from $49,901 to $46,164 and this reflects a lower average amount per client file.
One of the biggest surprises is the huge jump in the amount of unsecured joint debt per file. This went up from $58,655 to $72,612 or 24% in 3 years. This is an important number to track as it gives insight into trends within the banking industry.
Since more than 80% of the joint client files are home owners it appears that the banks are willing to grant significantly more debt to married couples who own their home. This, and the fact that spousal income has also increased indicates that the banks willingness to grant more credit is based on total household income and established asset base.
The 2nd significant group is common law files that jumped from $40,187 to $59,682 or 49%. This increase has been from marginal common law debt loads now filing as individuals and the remaining common law clients using their combined income to accumulate home ownership and larger debt loads.
The average unsecured debt load fell slightly despite the larger file sizes for married and common law partners due to the increase in individual filings and the lower debt loads of this group.
8-9 Average Creditors
Finally, the average number of creditors increased from 8 to 9 meaning that on average consumers have continued to increase the limits on their existing credit cards AND increased the number of credit cards they own.
This supports the longer term trend of consumer spending and the alarming amount of debt that Canadians continue to carry and service as part of their overall financial portfolio.
Methodology
This data was collected from 3000 families, individuals, and businesses we helped to restructure large amounts of debt in 2014.
When calculating the family income, we used net income as it is the standard in the industry, so that is what is left after all payroll deductions.
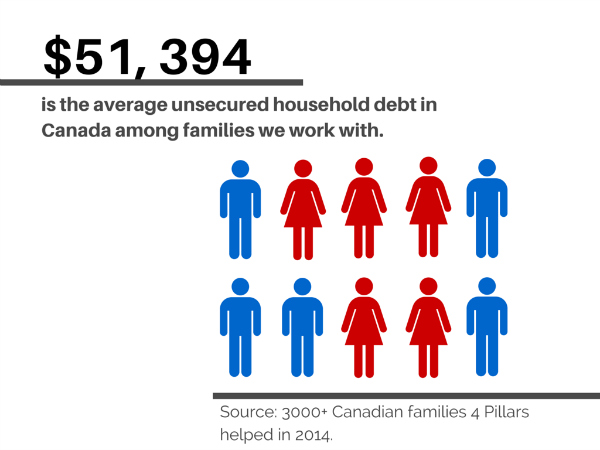
The $51,394 excludes all mortgages, loans against personal assets (think car loan, camper loans) but does include CRA, student loans (most of them are over 7 years) and shortfalls on returned assets and even foreclosures.
Thinking about citing this data?
You are free to cite this data in any media, so long as you credit 4 Pillars and, if possible, link back to our site at 4Pillars.ca.
Have a question about methodology or want more data? Media inquiries can be sent to paulm@4pillars.ca.
[…] This supports the longer term trend of consumer spending and the alarming amount of debt that Canadians continue to carry and service as part of their overall financial portfolio. – via http://www.4pillars.ca […]
[…] 2015 they estimated that the average Canadian family has a consumer debt of $51,394. It can be tough on how to tackle that amount of money, or scary for some. Especially if your […]